Predicting which song will be popular, can we do that?
Written by Harriman Samuel Saragih
Harriman Samuel Saragih is a Fulbright Scholar in Cornell University and an Assistant Professor in Prasetiya Mulya Business School where he teaches Data-Driven Marketing, Arts Marketing and Music Business Ecosystem

There have been various discussions seen from a variety of perspectives regarding music business as part of creative industries in TFR. In this article, I am seeking to write about music from a bit of nerdier perspective if you don’t mind. Predicting music popularity using Spotify’s audio features.
According to Statista as of Q1 in 2019, Indonesians use various platforms when it comes to streaming music with YouTube being the leading platform (64.5%) followed by Joox (50.9%), Spotify (46.6%), Google Play Music (20.5%), and Soundcloud (4.6%). In this article we are focusing on Spotify.
Some of you might be wondering: what is Spotify Audio Feature (SAF)? You can perhaps read the documentations for the complete explanation, but in layman terms, SAF is a sort of musical ‘ingredients’ or ‘components’ of a song that is quantifiable, making it possible for Researchers or Developers or Mathematicians – you name it - to examine numerical patterns and perhaps produce something out of it using various algorithms. Let’s see three examples of audio features:
Danceability: “A value of 0.0 is least danceable and 1.0 is most danceable.”
Consider the two extremes - Michael Buble’s “Ave Maria” (0.204) and “Sway” (0.713) as an illustration.
Key: “The key the track is in … e.g. 0 = C, 1 = C♯/D♭, 2 = D, … ”
In the two examples above, Spotify identifies “Ave Maria” in F (Major) and “Sway” in D (minor)
Popularity: “The popularity of the track. The value will be between 0 and 100, with 100 being the most popular.”
Ave Maria (59), Sway (71)
The above metrics and examples are just an overview of what can be further analyzed using various algorithms in machine learning. Another way to understand how these metrics may be able to explain trend in terms of music industry is illustrated on Figure 1. In terms of danceability, for example, songs started to be more danceable from around 1950 until 2020. Consequently, in terms of acousticness, the trend is the opposite – acoustic songs decrease through time (Figure 2).

Figure 1

Figure 2
You might be wondering, why does this happen? Seriously, I have been asking the same question and never got the time to understand it from e.g. cultural or economic points of view. Nevertheless, that is not the focus of this article. The main questions to me are: Can we really predict a song’s popularity based on its audio feature? Which features are the most important? What do I say about it?
Predicting hit song
Using simple correlation heatmap (Figure 3), a song’s popularity does correlate with several audio features e.g. loudness, energy, even year. Yes, there must be rationale behind this assumption which suggests that high popular songs tend to be highly energetic, loud, and recent. However, this logical assumption must be taken very carefully due to the high amount of data is massive. But, for fun’s sake, let us see how we can really make use of some mathematical analyses to answer the main question.

Figure 3
To perform our prediction, let’s try basic regression. In this example, we will use Random Forest Regression – RFR (What is that anyway? Doesn’t matter right?). In short, a regression aims to predict a specific target variable (in this case popularity) by some predictors (e.g. valence, acousticness, key).
Using a simple RFR, my analysis shows that we can predict a song’s popularity with 75% accuracy and 9.6 points of error. This means, SAF can indeed predict a song’s popularity pretty well (80% is not bad, right?). What are the important predictors? The results suggests that ten most important predictors are year, loudness, instrumentalness, duration, acousticness, danceability, energy, speechiness, explicit, and tempo. In the form of histogram (Figure 4), you can see characteristics of ‘popular song’ (popularity > 60) and consider how they are different with those less popular (Figure 5).
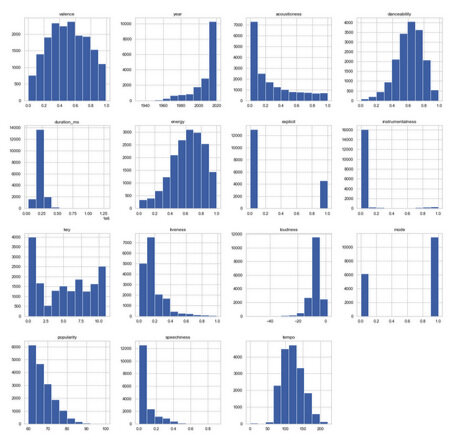
Figure 4

Figure 5
Case illustration
Consider an example from two of Earth, Wind & Fire’s (EWF) songs: ‘September’ and ‘Biyo’. These two songs popularity is 80 and 22, respectively (I know, who doesn’t know September?). Now, let’s assume that EWF’s songs with popularity less than or equal to 35 are considered ‘less popular’ and those greater are ‘more popular’. The question is, what audio features differentiate these two classes?
According to our prediction: valence, acousticness, energy, instrumentalness, and liveness are important predictors. Now are these factors different between those less and more popular? Figure 6 illustrates through visualization the answer to this question. We can infer that more popular songs tend to have higher valence and energy whereas less popular is likely to be less acoustic and liveness. More popular songs also tend to be non-instrumental i.e. they combined vocal and music accompaniment.

Figure 6
Then what?
Music artists, publishers, or producers can consider this result to better craft better marketing strategies – in the musical sense. For example, year is a good predictor for popularity. Recycling an old song with a new arrangement might perhaps be a good alternative to push popularity. Their music arrangements can consider the features e.g. duration, tempo, energy, and acousticness that can predict higher popularity. Instrumental artists, for example, might as well consider collaborating with vocalists, to expand its market in the music business.
On the one hand, musicians can better understand how the music industry work; they can craft their musical works to better (or choose not to) suit with what the market needs. On the other hand, Spotify also has the capability to monitor and shape people’s music listening behavior according to their algorithm.
Yes, musicians can make music based on what the market demands. Nevertheless, my objective is not to encourage music artists to produce music merely for popularity’s sake. That has never been my intention and will never be. My goal is really for artists to see the big picture that music streaming platforms have the capability to (1) understand and (2) potentially shape people’s listening behavior.
Technology might define and influence us what’s popular and what’s not. What’s important is how can musicians stay ‘true’ to their musical idealism or identity, while music listeners and scholars alike find ways to also support these musicians in whatever musical tunes they produce. The idea is to support every musician regardless of the popular needs. I argue that we need more educational effort and perhaps more studies on this in Indonesia, but at least, this article can provide a glimpse of how creativity, business, and mathematics should be seen comprehensively seen to support the stakeholders – particularly music artists in the industry to advance.
Disclaimer: The view expressed on opinion article doesn’t necessarily reflect the opinion of The Finery Report. The opinion belongs to the author of the article.


